
LinkedIn does not publish a best time to post that applies to everyone. In the LinkedIn Help pages we read on October 6, 2026, we found no page that names a best hour or a best day. What LinkedIn does document is analytics for your own posts, plus a scheduler you can use to run a timing test.
So the useful question is "when do my posts do best?" This guide shows where LinkedIn puts post-level numbers, how to test when to post on LinkedIn for your own audience, what the scheduler allows, and what TrackMedia's best-times view can and cannot tell you. We use no third-party "best time" figures, because they describe someone else's audience.
What is the best time to post on LinkedIn?
It depends on your own audience, and LinkedIn does not give one answer. We searched LinkedIn's Help Center for "best time to post" and "when to post". The results were mostly the Schedule posts page, job-posting pages and Post proofreader pages, and we read the result snippets rather than every page. We also opened LinkedIn's Best practices for sharing content page, which links to posting guides and names no time. We cannot prove no such page exists, only that we did not find one. The best day to post on LinkedIn is the same kind of question: you group your own per-post numbers by weekday and hour.
Where do you find timing data for your own LinkedIn posts?
LinkedIn documents post-level analytics for profiles and for Pages. None of the pages below describes a view that groups posts by hour or weekday, so you will build that grouping from your own log.
Which reports cover a personal profile?
LinkedIn's View post analytics for your content page says any member can open analytics for an individual post. The steps it gives for desktop are:
- Click the Me icon at the top of your LinkedIn homepage.
- Under Manage, click Posts & Activity.
- Click the Post, Videos, Images, Articles or Newsletter tab.
- Click the impressions count in the lower-left corner of the post, or View analytics in the lower-right corner.
Depending on the post type, the Post analytics page shows Discovery (In network and Out of network), Profile activity, Social engagement, Link engagement and Post viewer demographics. It adds that discovery and social engagement counts are available for 1,000 days for content types other than video, articles and newsletters, while video performance data is available for 180 days, so older posts stay usable for a timing review.
For several posts at once, LinkedIn's View your creator analytics page describes combined post analytics. Go to Me, then View Profile, scroll to the Analytics section and click Show all analytics, then click your post impressions number. You can pick a date range, switch between Impressions and Engagements, and click Export for an .XLSX file. The page does not say what columns the export holds, so check it for a posting time.
Which reports cover a company Page?
For a Page, the LinkedIn Page posts FAQ gives this path: go to your Page admin view, select Page posts in the left pane, choose the post, open the Preview results dropdown and click Show all results. It lists organic impressions and members reached, plus click-through rate, reactions, comments, reposts and the overall engagement rate.
LinkedIn's Content analytics for your LinkedIn Page page adds a content engagement table by individual post. It filters by time range and has a Created column, which the page describes as the date each post was posted. It names a date, not an hour, so keep your own record of the posting time.
That page defines engagement rate as interactions per impressions, where interactions include clicks, reactions, comments and shares. It calls impressions an estimate that "may not be precise", one more reason to treat small gaps as noise.
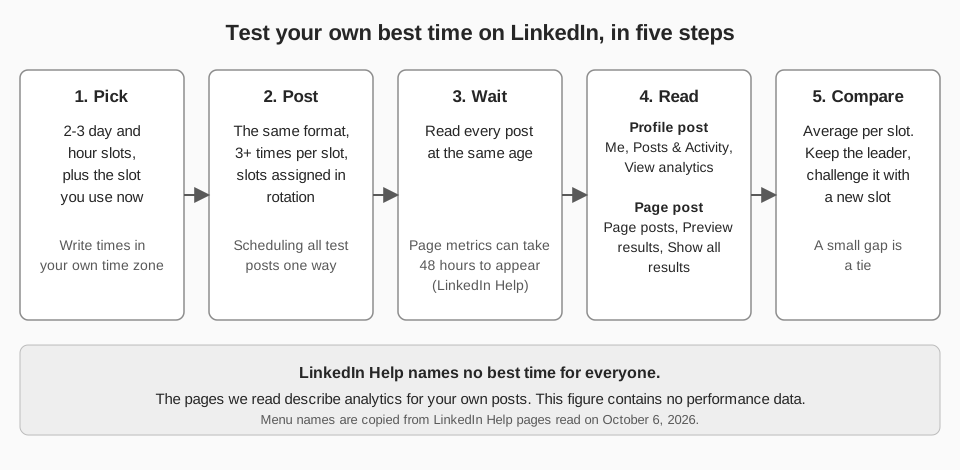
How do you test when to post on LinkedIn?
Treat any slot that looks good as a guess, then test it. This is our suggested method, not one LinkedIn recommends.
- Pick two or three candidate slots. A slot is a weekday plus an hour, such as Tuesday at 9:00. Add the slot you use today as a baseline.
- Post a similar post in each slot. Keep the format alike (text, image, video, document) so you compare times and not formats. Assign slots by strict rotation or coin flip before you see any result. Aim for at least three posts per slot, the same minimum TrackMedia uses before it ranks a slot.
- Read every post at the same age. LinkedIn's Page analytics page says metrics might take 48 hours to be reflected, except reactions and comments, which update in real time. The profile pages we read give no delay, so two days is our suggestion for both.
- Log one number per post. Record date, slot, format, impressions and engagements, then divide engagements by impressions for a rate. For a profile, that division is your own calculation.
- Compare averages per slot, and look at the spread. If the gap between two slots is no bigger than the spread of posts inside one slot, you have no evidence of a difference.
- Repeat later. Your network and topics change, so rerun the test every few weeks.
Here is a worked example with invented numbers, not LinkedIn data. Slot A's three posts have rates of 2.0%, 3.0% and 4.0%, an average of 3.0%. Slot B's have 1.0%, 2.0% and 6.0%, an average of 3.0%. Slot B holds the best single post and the same average, so the honest result is a tie, and you keep testing. The same method works on other networks, as in our guide to the best day to post on Instagram.
Can you schedule LinkedIn posts for a time slot?
Yes, and scheduling makes a slot test easier: write the posts in one sitting and let each go out in its own slot. LinkedIn documents separate rules for profiles and Pages:
| Rule | Profile | Page |
|---|---|---|
| Who can schedule | Members, per Schedule posts | Super admins and content admins, per Schedule a LinkedIn Page post |
| Time window | 10 minutes to 3 months from now | An hour to three months from now |
| Time zone | Standardized in UTC from your device's time zone (the mobile tab says "relative to your current location") | Based on your location |
| Not schedulable | Events, jobs, services | Events, multiple photos, reshares, polls, jobs, services |
The profile page also says you can enter an exact time rather than use the 30-minute options in the dropdown, and the Page page says the same. For where scheduled posts are listed and how to edit them, see our guide to seeing and editing scheduled posts on LinkedIn.
What does TrackMedia's best-times view show?
TrackMedia reports when your own posts landed best. Open Analytics and choose the Best times tab. The panel titled "When your posts land best" shows a weekday-by-hour grid in your workspace's time zone, built from posts that went out in the range you chose (7, 30 or 90 days, or a custom window). The network filter in the toolbar lets you look at LinkedIn alone.
- What it averages. Each post's engagement rate, averaged per slot. For LinkedIn, TrackMedia's code computes it as likes plus comments plus shares plus clicks, divided by impressions and capped at 100%. It is built from what LinkedIn returns to TrackMedia, so do not compare it digit for digit with LinkedIn's own rate.
- What it ranks. "Your strongest slots" lists up to five, and only slots with at least three posts. Slots with fewer are shown in grey and are not ranked.
- Which time it uses. The hour a post actually went out, not the hour it was scheduled for. The grid also counts posts imported from a connected account, not only posts published through TrackMedia, and the code's LinkedIn connector can list recent posts for import.
- In the composer. When you schedule, the time picker can offer up to two "Best" quick picks from the last 90 days. They are calculated across all your networks together, not for LinkedIn alone.
The honest limits: the grid describes what happened, not what will happen, and it cannot separate a good hour from a good post. A slot with no reported rate shows "No rate reported", and TrackMedia only has a rate for a LinkedIn post if LinkedIn returns impressions for it, which depends on the permissions LinkedIn has granted the connection. TrackMedia's code includes a LinkedIn connector for personal profiles. We have not confirmed that posting to Company Pages through TrackMedia is live, so this guide does not cover it, and LinkedIn's own Page analytics remain the place to read Page numbers.
TrackMedia holds the schedule itself and posts at the chosen time (see publishing). To schedule your test slots and read results per hour in one place, you can start free with TrackMedia.
How we checked this
We opened each LinkedIn Help page below in our own browser tab on October 6, 2026 and copied labels, numbers and limits from it. We did not run a timing test on a live LinkedIn account, and we did not open the analytics screens themselves, so on-screen labels may differ from the Help text.
- View post analytics for your content (LinkedIn Help): profile post analytics path, sections shown, availability periods.
- View your creator analytics (LinkedIn Help): combined post analytics steps, impressions or engagements toggle, .XLSX export.
- Content analytics for your LinkedIn Page (LinkedIn Help): Page metrics, engagement rate definition, 48-hour note, Created column.
- LinkedIn Page posts FAQ (LinkedIn Help): Page post analytics path and what it shows.
- Schedule posts (LinkedIn Help): profile scheduling window, UTC note, unsupported types.
- Schedule a LinkedIn Page post and Scheduled posts for LinkedIn Pages (LinkedIn Help): Page scheduling window, roles, unsupported types.
- LinkedIn Help search for "best time to post" and "when to post" (linkedin.com/help/linkedin/search), and Best practices for sharing content on LinkedIn (LinkedIn Help): no timing guidance in the result snippets or on that page.
What we could not verify: any LinkedIn page that states a universal best time (we found none and cannot prove none exists); the columns in the combined analytics export; whether any LinkedIn report groups posts by hour or weekday on screen; and any delay before profile post metrics settle. TrackMedia's own behavior comes from its analytics, composer and LinkedIn connector code, read the same day.